Monitoring & Reporting (91)
Children categories

Flood Risk/Hazard Mapping Reports (61)
Learn More:
- Contact Tyler Bauman, Water Resources Engineer (Flood Management)
In cooperation with local municipalities and the province, the RVCA identifies, studies and maps natural hazard areas along local rivers, lakes, streams and wetlands. Natural hazard areas include floodplains, unstable slopes. Natural features such as wetlands are also mapped. In the past, these maps were called flood risk maps.
If not understood or dealt with effectively, these hazards can pose risks and problems to society, especially when considering development activities.
Hazard mapping is used by watershed municipalities when updating Official Plan and Zoning Schedules and in the review of development applications under the Planning Act. The RVCA uses the mapping for the administration and enforcement of regulations made under the Conservation Authorities Act (Section 28).
Ottawa River Flood Plain Mapping Report, MacLaren Plansearch, December 1984 - Superseded
Ottawa RIver Flood Risk Mapping Report, Shirley's Bay to Cumberland 2014
Otter and Hutton Creeks - Flood Risk and Generic Regulation Limits Mapping Along Otter and Hutton Creeks, 2016

Otter Lake Regulatory Flood Risk Mapping Report, 2011
Otty Lake Regulatory Flood Risk Mapping Report, 2011
INSTRUCTIONS
1) A user-defined time frame can be selected via the "FROM DATE" and "TO DATE" tools above (Date Format: YYYY-M-D). An active 90-day window is loaded by default.
2) Chart and data export functionality is available via the [ ≡ ] icon at the top right of the chart area.
3) Series may be toggled on/off by clicking on the associated legend elements at the bottom of the chart.
4) Data values can be reviewed by hovering over the desired series.
DATA STATUS - PROVISIONAL
The RVCA cannot guarantee the accuracy of the provided data. Data accuracy can be affected by a number of factors including, but not limited to: Ice and/or sediment accumulation, backwater effects and equipment malfunction/maintenance. Users of the RVCA's real-time data are cautioned to consider the unverified nature of the information before using it for decision that concern personal or public safety or the conduct of business.
STATION METADATA
Station Metadata [SNOW-MNR-3306]
STATUS: Active, Seasonal
ABOUT THIS DATA:
The biweekly snow depth (cm) and snow water equivalent (mm) for the Pierces Corners region (SNOW-MNR-3306). Field monitoring conducted by the RVCA. Statistics have been generated by the RVCA from the period between 1977-2019 (42 years). These statistics include the biweekly median (50th percentile), interquartile range (data range between the daily 25th and 75th percentiles) and the maximum snow water volume measured over the period of record. The median and interquartile range represent the typical normal snow water volume observed at this time of year over the historic record.
DATA TIME-SERIES:
Biweekly, Field Measurement, Snow Depth (SD); centimeters
Biweekly, Field Measurement, Snow Water Equivalent (SWE); millimeters
Biweekly, Lower Quartile (25th Percentile; Historic Normal Water Equivalent); millimeters
Biweekly, Median (50th Percentile; Historic Normal Water Equivalent); millimeters
Biweekly, Upper Quartile (75th Percentile; Historic Normal Water Equivalent); millimeters
LOCATION: UTM 18T [X: 444984.3], [Y: 4988113.9]
SUBWATERSHED: Lower Rideau River
PERIOD OF RECORD (RVCA ARCHIVE): Jan/1977 - Present
OWNER/OPERATOR: Rideau Valley Conservation Authority
DATA AVAILABILITY: Biweekly field monitoring from Oct-June
STATISTICS: RVCA statistics calculated from the 1977-2019 period of record.
a) Upper Quartile (Historic Normal)
Statistics Interval - 1 Year, Recurring
Extraction Interval - Biweekly (15 Days); No Aggregation
Statistics Type: 75th Percentile
Update Frequency: Biweekly
b) Lower Quartile (Historic Normal)
Statistics Interval - 1 Year, Recurring
Extraction Interval - Biweekly (15 Days); No Aggregation
Statistics Type: 25th Percentile
Update Frequency: Biweekly
c) Median (Historic Normal)
Statistics Interval - 1 Year, Recurring
Extraction Interval - Biweekly (15 Days); No Aggregation
Statistics Type: 50th Percentile
Update Frequency: Biweekly
DATA UNCERTAINTY:
The RVCA cannot guarantee the accuracy of the provided data. Data accuracy can be affected by a number of factors including, but not limited to: Equipment malfunction/maintenance, regional climate conditions and site disturbance. Users of the RVCA's data tools are cautioned to consider the unverified nature of the information before using it for decisions that concern personal or public safety or the conduct of business.
DATA SOURCES:
MNRF Snow Collection Protocol
CONTACT:
For for more information, please contact:
Richmond (Village of) Flood Risk Mapping Report, Van Gaal and Arbuckle Municipal Drains, 2009
Rideau River Flood Risk Mapping - Rideau River Hydrological Analysis for the Purposes of Flood Risk Mapping, May 29, 2017

More...
Rideau River Flood Risk Mapping from Hogs Back to Kars, July 2017
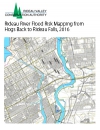
Rideau River Flood Risk Mapping from Hogs Back to Rideau Falls, 2016
Rideau River Flood Risk Mapping from Kars to Burritts Rapids, July 2017